If you’ve ever stared at a chart and thought,
“What am I supposed to see here?” — you’re not alone.
But what if I told you the market leaves behind clues, and all you need to do is learn how to spot the shapes?
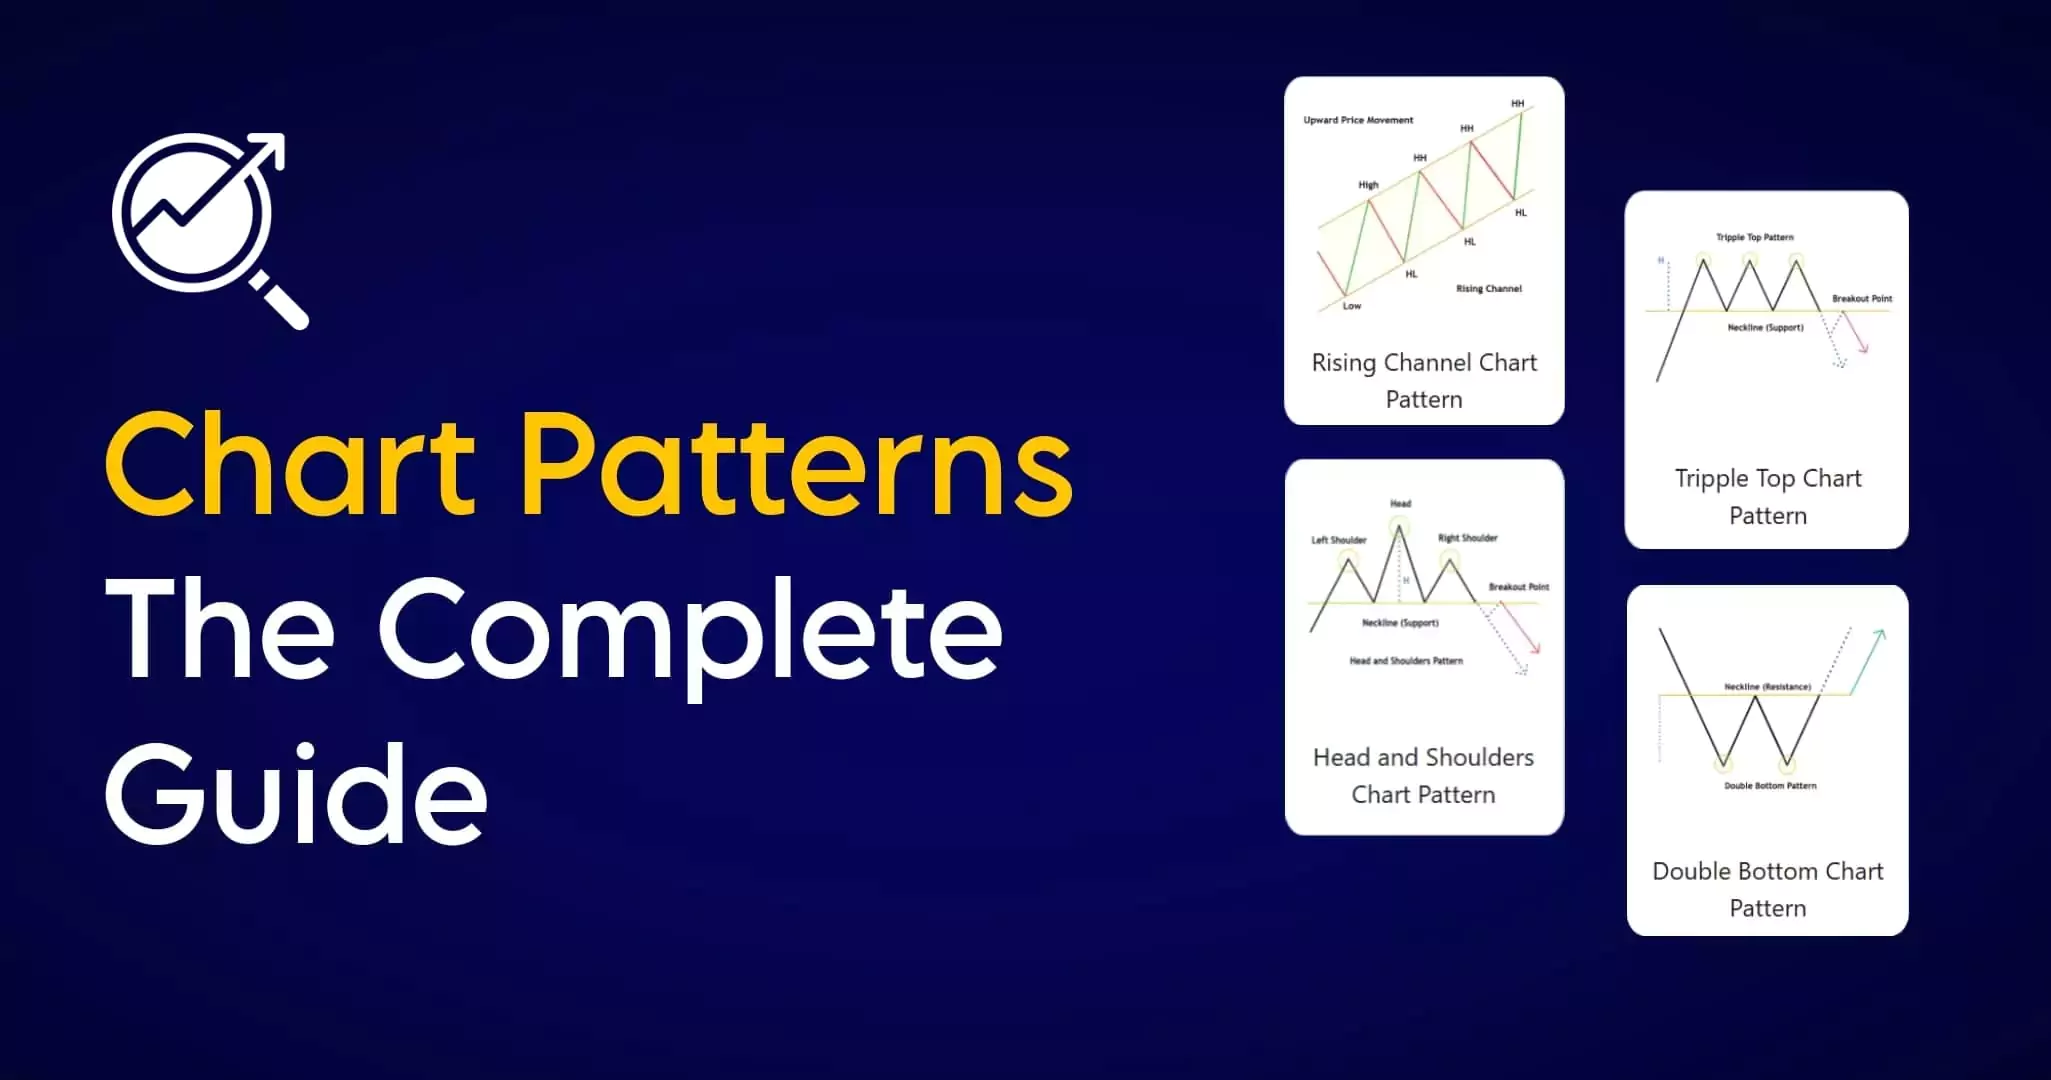
That’s exactly what chart patterns are: visual clues that tell you what price might do next.
In this article, you’ll learn about 3 of the most powerful and popular chart patterns:
- ✅ Head & Shoulders
- ✅ Triangles (Ascending, Descending & Symmetrical)
- ✅ Flags (Bull Flags & Bear Flags)
Let’s break them down — no complicated lingo, just clear explanations and real trading value.
🧠 What Are Chart Patterns?
Chart patterns are formations created by price movements on a chart. They often signal:
- A reversal (trend might change)
- A continuation (trend might continue)
Smart traders use these patterns to spot potential trade setups, manage risk, and improve their timing.
Let’s dive into each pattern and see how they work.
🟣 1. Head & Shoulders Pattern
🔄 Type: Reversal Pattern
This pattern signals a possible trend reversal — usually from uptrend to downtrend.
🔍 What It Looks Like:
- Left Shoulder: Price rises, then dips
- Head: Price rises higher, then dips again
- Right Shoulder: Price rises, but lower than the head, then falls
- Neckline: Connects the lows (support level)
Once price breaks below the neckline, it’s a strong sell signal.
📈 Inverse Head & Shoulders:
- Same pattern, flipped upside down
- Signals a bullish reversal (downtrend turning into an uptrend)
✅ How to Trade It:
- Wait for a neckline break
- Place a sell order (or buy for inverse)
- Stop loss: Above the right shoulder (or below in inverse)
- Target: Same height as the head to neckline distance
🔺 2. Triangle Patterns
🔄 Type: Can Be Reversal or Continuation (depends on context)
Triangles show consolidation — a period where price gets squeezed before breaking out.
🟥 3 Main Types:
🔹 A. Ascending Triangle (Bullish)
- Flat top (resistance)
- Rising bottom (higher lows)
- Buyers are getting stronger
📌 Usually breaks upward
🔹 B. Descending Triangle (Bearish)
- Flat bottom (support)
- Falling top (lower highs)
- Sellers are gaining strength
📌 Usually breaks downward
🔹 C. Symmetrical Triangle (Neutral)
- Lower highs + higher lows
- Price is coiling up
- Breakout can go either direction
✅ How to Trade Triangles:
- Identify the triangle forming
- Wait for breakout + retest of the breakout level
- Enter trade in the breakout direction
- Stop loss: Below/above last swing point
- Target: Height of triangle added to the breakout point
📌 Be patient — fake breakouts are common!
🚩 3. Flag Patterns
🔄 Type: Continuation Pattern
Flags form after a strong price move — the market pauses, consolidates, and then continues in the same direction.
It’s like a pit stop before the next leg.
🔹 Bull Flag:
- Strong upward move (flagpole)
- Small downward sloping channel (the flag)
- Followed by a breakout upward
📌 Signal: Trend continuation upward
🔻 Bear Flag:
- Sharp downward move (flagpole)
- Small upward sloping channel (the flag)
- Breaks downward
📌 Signal: Trend continuation downward
✅ How to Trade Flags:
- Identify the flagpole and flag
- Wait for breakout of the flag
- Enter trade in breakout direction
- Stop loss: Below/above flag pattern
- Target: Same length as the flagpole
⚠️ Chart Pattern Trading Tips
- 🔍 Zoom out: Look at bigger timeframes to confirm pattern validity
- ⏳ Be patient: Wait for confirmation — don’t guess
- 📏 Use risk management: Always set stop loss and target
- 🔄 Combine with price action: Candlesticks + support/resistance = stronger signals
🧩 Quick Recap Table
| Pattern Name | Type | Direction | Entry Trigger | Target Estimate |
|---|---|---|---|---|
| Head & Shoulders | Reversal | Bearish or Bullish | Neckline Break | Height from head to neckline |
| Ascending Triangle | Continuation | Bullish | Resistance Break | Height of triangle |
| Descending Triangle | Continuation | Bearish | Support Break | Height of triangle |
| Symmetrical Triangle | Breakout | Either direction | Trendline Break | Height of triangle |
| Bull Flag | Continuation | Bullish | Break above flag | Length of flagpole |
| Bear Flag | Continuation | Bearish | Break below flag | Length of flagpole |
🧠 Final Thoughts: Let the Market Draw the Picture
Chart patterns aren’t just shapes — they’re a way to understand market psychology.
- Head & Shoulders = momentum is shifting
- Triangles = price is coiling, breakout is near
- Flags = trend is pausing before continuing
The key is to wait for confirmation, manage your risk, and use patterns as part of a complete strategy, not the whole strategy.
📌 Remember:
Patterns don’t guarantee results — but they can give you an edge, and in trading, that edge makes all the difference.