If you’re new to trading and wondering what all those squiggly lines below the chart mean — don’t worry, you’re not alone!
Most beginner traders come across indicators like RSI, MACD, and Stochastic Oscillator early on, but don’t really understand how to use them.
The good news?
You don’t need to be a math genius to use these tools. You just need to know what they do, how to read their signals, and how to avoid the most common mistakes.
Let’s break it down.
🧠 What Are Indicators?
Indicators are technical tools that help traders analyze price movement. They don’t predict the future — but they help you:
- Spot overbought/oversold conditions
- Identify momentum and trend strength
- Time potential entries and exits
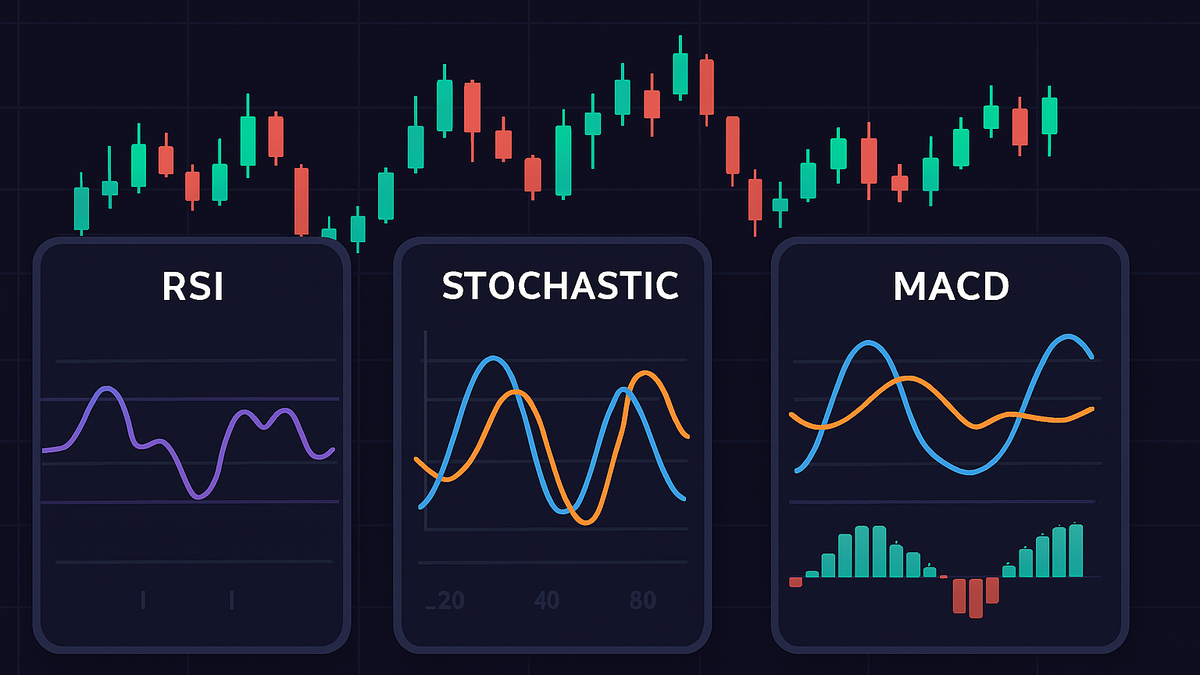
Three of the most popular indicators used by traders are:
✅ RSI (Relative Strength Index)
✅ MACD (Moving Average Convergence Divergence)
✅ Stochastic Oscillator
Let’s explore each one in simple terms.
🔹 1. RSI (Relative Strength Index)
📌 What It Is:
The RSI is a momentum indicator that measures how fast price has moved up or down over a set period (usually 14 periods).
It gives a value between 0 and 100, showing whether an asset is overbought or oversold.
📊 How to Read RSI:
- Above 70 = Overbought (possible reversal or pullback)
- Below 30 = Oversold (possible bounce or reversal)
🧠 What It Tells You:
- RSI helps you spot potential turning points
- When RSI hits extreme levels, price may be due for a change
✅ Example Use:
- RSI hits 80 → Market is overbought → Look for signs to sell
- RSI hits 20 → Market is oversold → Look for signs to buy
⚠️ Don’t trade RSI alone! Always confirm with price action or other indicators.
🔸 2. MACD (Moving Average Convergence Divergence)
📌 What It Is:
The MACD is a trend-following momentum indicator. It shows the relationship between two moving averages (12 EMA and 26 EMA).
It has 3 parts:
- MACD Line
- Signal Line
- Histogram (the bars)
📊 How to Read MACD:
- When MACD line crosses above signal line = Buy signal
- When MACD line crosses below signal line = Sell signal
- Histogram bars show momentum strength:
- Bars growing = trend is strong
- Bars shrinking = trend is weakening
🧠 What It Tells You:
- Helps confirm trend direction and strength
- Identifies potential entry/exit signals
✅ Example Use:
- MACD crossover + price breaking resistance = Strong buy signal
- MACD divergence (price makes higher highs, MACD makes lower highs) = Possible reversal
🔹 3. Stochastic Oscillator
📌 What It Is:
The Stochastic Oscillator compares the current price to the price range over a set period (usually 14 periods).
It’s also a momentum indicator, similar to RSI, but more sensitive.
It gives a reading between 0 and 100.
📊 How to Read Stochastic:
- Above 80 = Overbought
- Below 20 = Oversold
- Crossovers of %K and %D lines give trade signals:
- %K crosses above %D in oversold = Buy
- %K crosses below %D in overbought = Sell
🧠 What It Tells You:
- Overbought/oversold levels with more frequent signals
- Useful in range-bound or sideways markets
✅ Example Use:
- Stochastic is below 20 and crosses upward → Possible buy
- Stochastic is above 80 and crosses downward → Possible sell
⚖️ Quick Comparison Table
| Indicator | Best For | Key Signal | Watch Out For |
|---|---|---|---|
| RSI | Overbought/Oversold | Above 70 / Below 30 | False signals in trends |
| MACD | Trend & Momentum | Line crossovers & divergence | Late entries in fast markets |
| Stochastic | Range markets | Crossovers at 80/20 levels | Too sensitive in volatile markets |
🧩 How to Use Them Together (Combo Strategy)
Many traders combine these indicators for better confirmation.
📌 Example Trading Strategy:
- RSI below 30 → Oversold condition
- MACD crossover upward → Bullish signal
- Stochastic crosses upward below 20 → Entry confirmation
✅ This combo = Strong buy signal (especially if price is near a support level)
📌 Always confirm with candlestick patterns and price action.
🚫 Common Mistakes to Avoid
❌ Relying only on indicators
👉 Indicators are tools — not magic. Use them with chart patterns and key levels.
❌ Buying just because RSI is oversold
👉 Oversold doesn’t mean the price will bounce immediately. Wait for confirmation.
❌ Ignoring the trend
👉 Indicators work best with the trend. Don’t use them to fight strong moves blindly.
❌ Overcomplicating your chart
👉 Stick to 1–2 indicators max. Too many indicators = analysis paralysis.
🧠 Final Thoughts: Indicators Help, But You’re the Boss
RSI, MACD, and Stochastic are powerful tools — when used the right way.
They can help you:
- Time your trades
- Understand momentum
- Avoid bad entries
But remember, they are lagging tools. They don’t show the future. They reflect what has already happened.
📌 Your best edge as a trader? Learn to read price action, use key levels, and let indicators support (not lead) your decisions.