If you’ve ever heard traders talk about “Fibs” and wondered what they mean — you’re not alone! The word Fibonacci might sound complicated, but in trading, it’s actually a simple tool that can help you spot where the market might pause, bounce, or even reverse.
Welcome to the world of Fibonacci Retracements — one of the most popular tools used by forex traders. In this article, we’ll break it down step-by-step, in a way that’s not only easy to understand, but fun to learn too!
📚 What is Fibonacci Retracement?
Fibonacci Retracement is a technical analysis tool used to predict possible support and resistance levels based on the famous Fibonacci sequence — a series of numbers found everywhere in nature, from seashells to galaxies.
In trading, Fibonacci levels help you figure out how far the price might pull back (or retrace) before continuing in the direction of the trend.
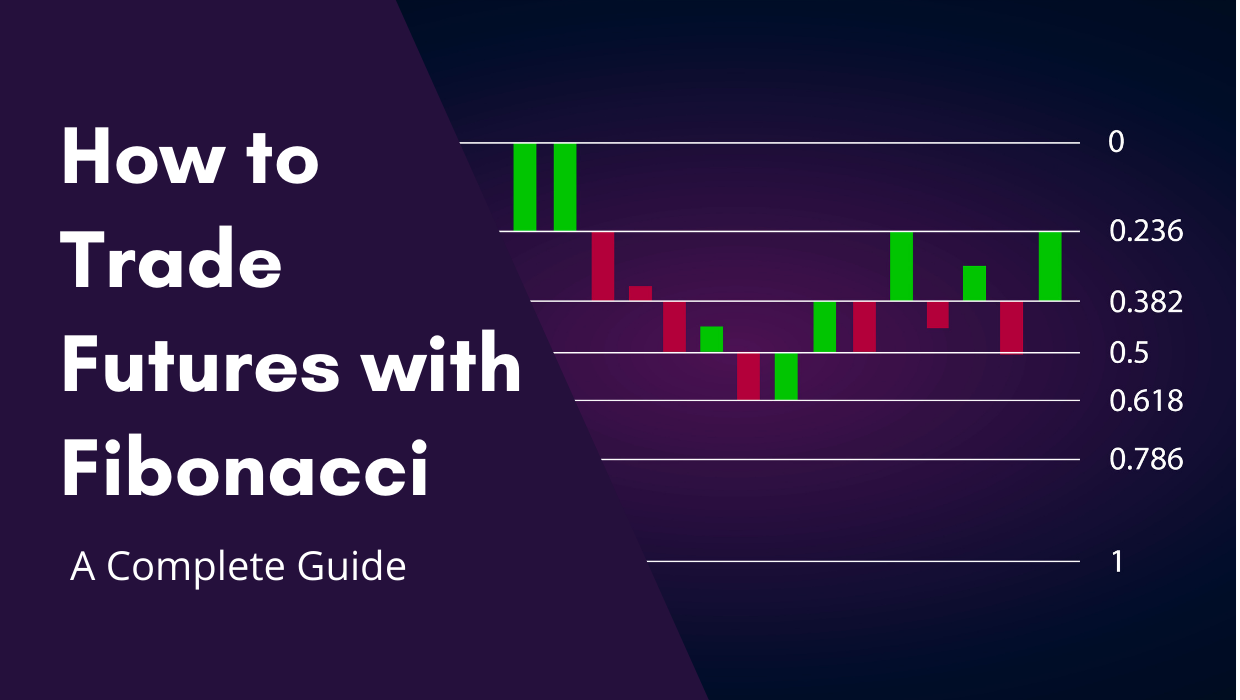
🔢 The Magic Numbers (Fibonacci Levels)
The key Fibonacci retracement levels you’ll see on your chart are:
- 0.236 (23.6%)
- 0.382 (38.2%)
- 0.500 (50%) (not a Fibonacci number but commonly used)
- 0.618 (61.8%)
- 0.786 (78.6%)
These levels act like invisible barriers where price often bounces or hesitates. The most important level is 61.8%, also known as the “Golden Ratio.”
🎯 Why Use Fibonacci Retracements in Forex?
Forex markets are driven by trends, emotions, and psychology. Fibonacci levels help traders:
✅ Spot potential entry points
✅ Find support and resistance
✅ Set stop-loss and take-profit levels
✅ Combine with other tools for better accuracy
🛠 How to Draw Fibonacci Retracements (Step-by-Step)
Let’s say you’re trading a currency pair (like EUR/USD), and you’ve spotted a strong uptrend.
👉 Here’s how you use Fibonacci retracements:
✅ Step 1: Identify the Trend
- Look for a clear swing high and swing low.
- In an uptrend, draw from the low to the high.
- In a downtrend, draw from the high to the low.
✅ Step 2: Apply the Fibonacci Tool
- Open your trading platform (like MetaTrader, TradingView, etc.).
- Select the Fibonacci Retracement tool.
- Click at the start of the move (swing low or high).
- Drag it to the end of the move (swing high or low).
🎨 The levels (23.6%, 38.2%, 50%, 61.8%, 78.6%) will appear on your chart like horizontal lines.
✅ Step 3: Watch How Price Reacts
- The price often retraces to one of these levels before continuing in the trend’s direction.
- Look for signs like candlestick patterns or volume spikes to confirm a possible bounce.
📈 Real-World Example
Let’s say EUR/USD moves from 1.0500 to 1.1000.
- You draw the Fib retracement from 1.0500 (low) to 1.1000 (high).
- The 61.8% level would be around 1.0690.
- If the price retraces down to that level and shows a bullish candlestick (like a hammer or engulfing pattern), it might be a good time to enter a buy trade.
🧠 Pro Tips for Using Fibonacci in Forex
✅ 1. Combine with Other Tools
Fibonacci works best when used with:
- Trendlines
- Support/Resistance Zones
- Indicators like RSI, MACD, or Moving Averages
- Candlestick patterns (like pin bars, hammers, etc.)
✅ 2. Use on Higher Timeframes
Fibonacci retracements are more reliable on 4H, Daily, or Weekly charts than on lower timeframes.
✅ 3. Don’t Force It
Only use Fibonacci when the market has made a clear move. Don’t try to draw it where there’s no strong trend — it’ll only confuse you.
✅ 4. Plan Your Trade
Use the Fib levels to:
- Set your entry point
- Place your stop-loss below the last swing low (in an uptrend)
- Target higher Fib extensions like 1.272 or 1.618 for take-profit (advanced trick!)
❌ Common Mistakes to Avoid
🚫 Using Fib on choppy, sideways markets
🚫 Forcing lines on unclear trends
🚫 Ignoring price action and trading blindly
🚫 Relying only on Fibonacci without confirmation
Remember: Fibonacci retracements show probabilities, not guarantees.
💡 Bonus: What About Fibonacci Extensions?
Once you master retracements, check out Fibonacci Extensions. These help you predict how far the price might go after the retracement is done — perfect for setting profit targets!
📌 Summary – Fibonacci Retracements Made Simple
| Feature | What It Does |
|---|---|
| 📐 Fibonacci Retracements | Predict where the price might pull back |
| 🧭 Key Levels | 23.6%, 38.2%, 50%, 61.8%, 78.6% |
| 📈 Draw Tool | From swing low to high (or high to low) |
| 🔄 Best Used In | Trending markets |
| 🛠 Combine With | Trendlines, indicators, price action |
| ❗ Warning | Don’t use it alone or in sideways markets |
🎉 Final Thoughts
Fibonacci retracements are like a trader’s secret weapon. They’re simple, effective, and based on patterns that repeat again and again in the market — just like in nature.
Whether you’re new to forex or looking to sharpen your skills, learning how to use Fibonacci retracements can give you an edge. Just remember: Patience, practice, and confirmation are the keys to success.
So next time the market pulls back, don’t panic — pull out your Fibonacci tool and let the magic numbers guide your strategy! 🔢✨