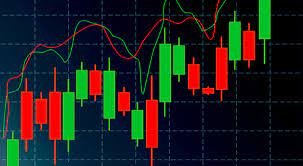
If you’re stepping into the exciting world of trading, whether Forex, stocks, or cryptocurrencies, candlestick charts are one of the most powerful tools you’ll encounter. They help you visualize price movements, spot trends, and make informed trading decisions.
But how exactly do you read candlestick charts? This article will guide you step-by-step through understanding candlesticks, their patterns, and how to use them to your advantage.
🔥 What Are Candlestick Charts?
Candlestick charts are a type of price chart used to represent the movement of an asset over a specific time frame — like minutes, hours, days, or weeks.
Each candlestick shows four key prices during that period:
- Open (the price at the start of the period)
- Close (the price at the end of the period)
- High (the highest price reached)
- Low (the lowest price reached)
The beauty of candlesticks is they visually display this information in a way that’s easy to grasp, even at a glance.
🕯️ Anatomy of a Candlestick
Every candlestick has two main parts:
1. The Body
The thick part of the candle represents the difference between the open and close prices.
- If the close price is higher than the open, the body is usually green or white, indicating a bullish move (price went up).
- If the close price is lower than the open, the body is red or black, signaling a bearish move (price went down).
2. The Wicks (or Shadows)
The thin lines extending above and below the body represent the high and low prices during that period.
- The upper wick shows the highest price.
- The lower wick shows the lowest price.
📈 Why Candlestick Charts Are Useful
- Clear Visuals: Quickly see if buyers or sellers dominated a time period.
- Trend Identification: Spot uptrends, downtrends, or sideways movements.
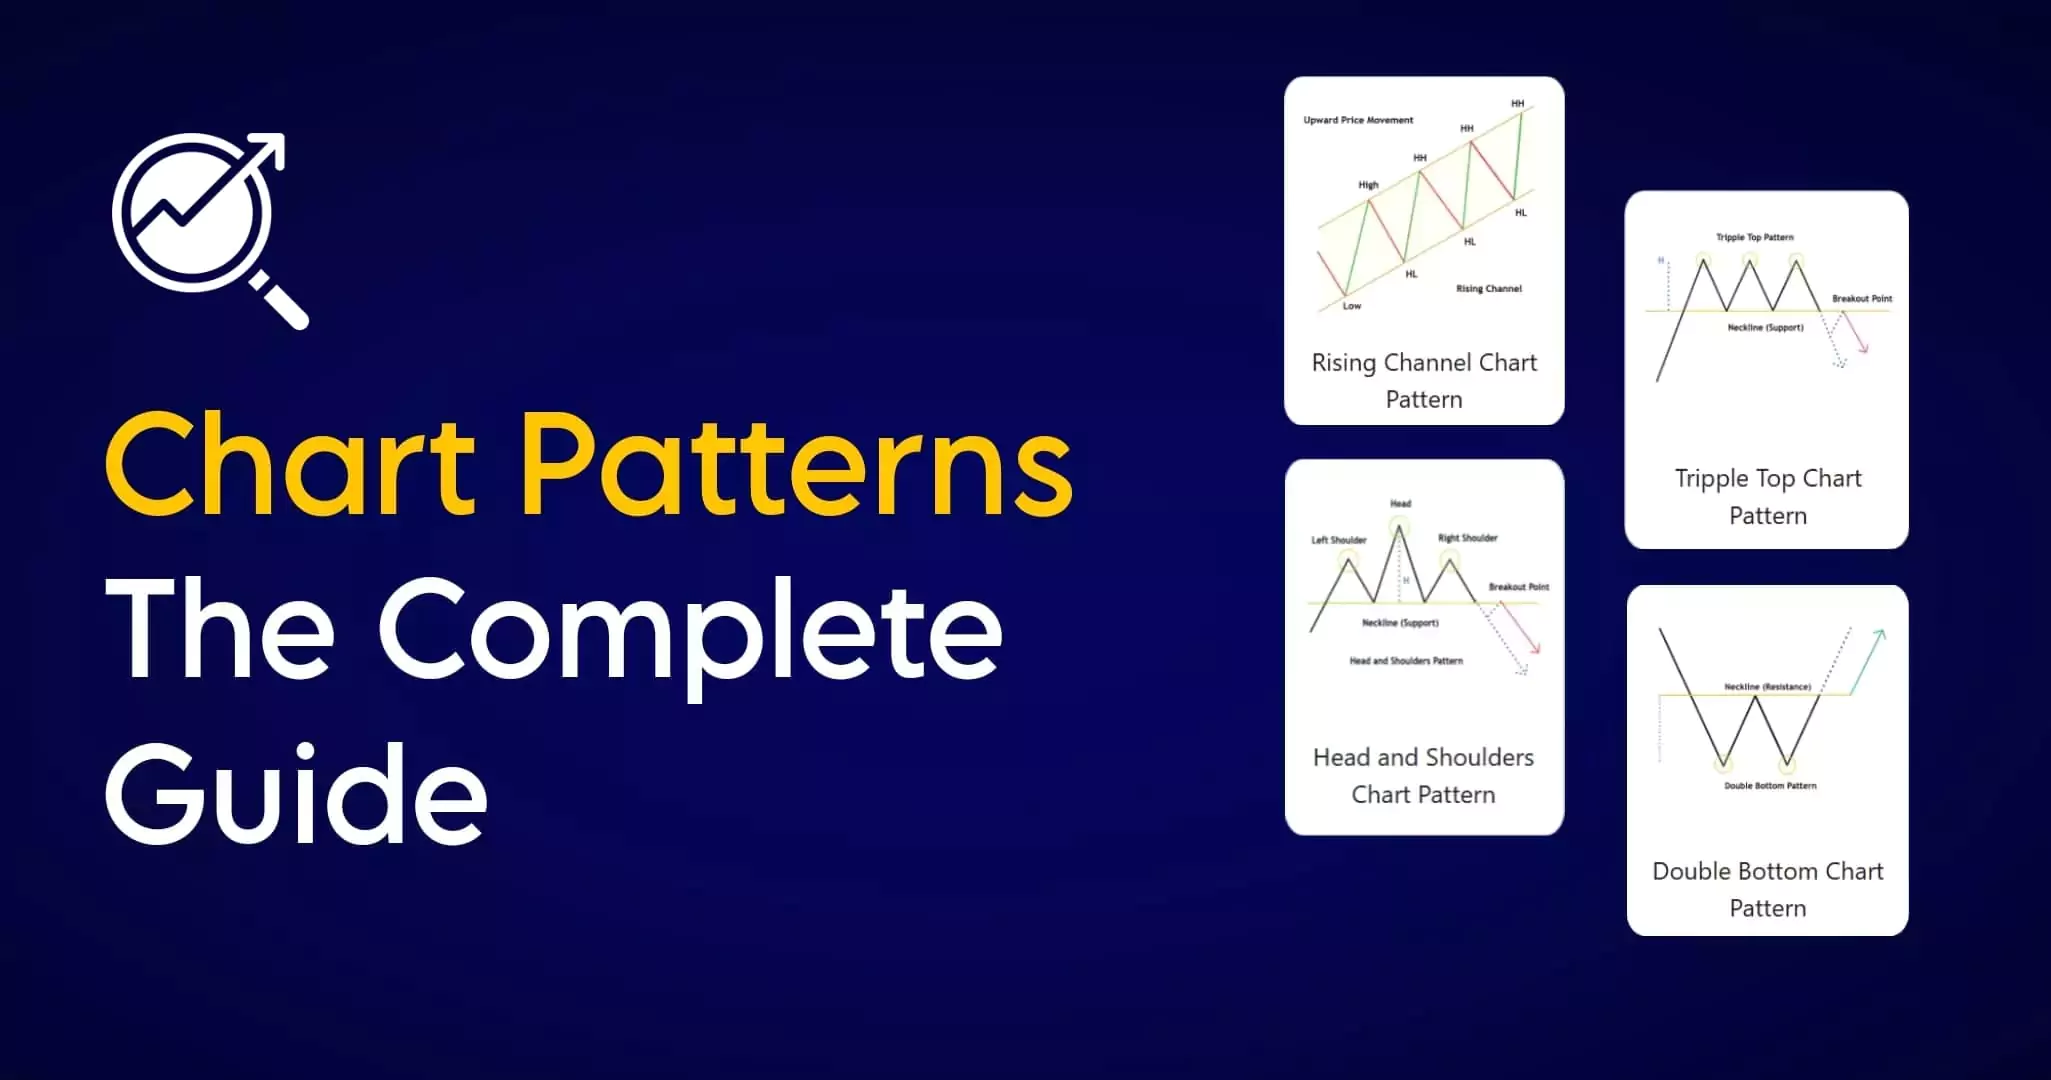
- Pattern Recognition: Identify candlestick patterns that can hint at potential reversals or continuations.
🔍 Common Candlestick Patterns to Know
1. Doji
A candlestick where the open and close prices are nearly the same, resulting in a very small or no body. It shows market indecision and often signals a possible reversal.
2. Hammer & Hanging Man
- Hammer: A small body with a long lower wick, found after a downtrend. It suggests buyers are stepping in, and a reversal might occur.
- Hanging Man: Similar shape but found after an uptrend, signaling potential bearish reversal.
3. Engulfing Pattern
- Bullish Engulfing: A small bearish candle followed by a larger bullish candle that completely “engulfs” the previous one, indicating a potential upward reversal.
- Bearish Engulfing: The opposite — a small bullish candle followed by a large bearish candle, hinting at a possible downward reversal.
4. Shooting Star
A candle with a small body near the low of the period and a long upper wick. It appears after an uptrend and signals a possible reversal downward.
🛠️ How to Use Candlestick Charts in Your Trading
- Combine candlestick patterns with support and resistance levels to confirm trade setups.
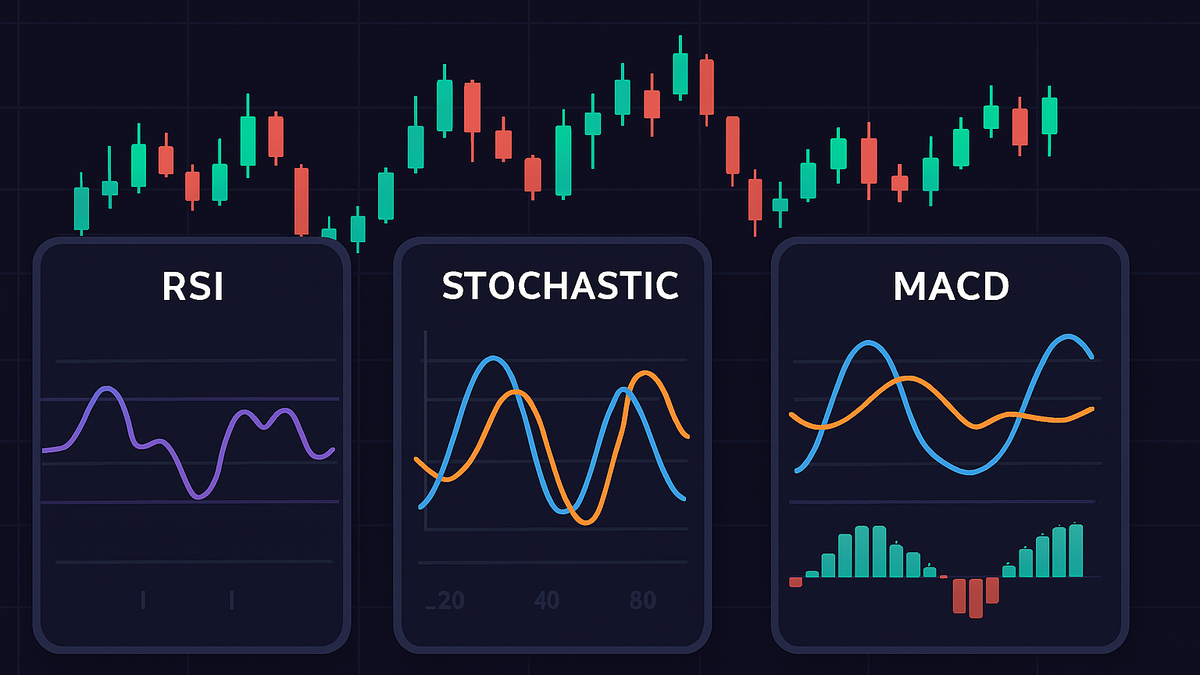
- Use candlesticks with technical indicators like moving averages or RSI for stronger signals.
- Pay attention to volume during candlestick formations to validate moves.
⚠️ Tips for Beginners
- Don’t rely solely on candlestick patterns — always consider the bigger picture.
- Practice reading candlestick charts on demo accounts before trading real money.
- Learn to identify false signals; no pattern is 100% guaranteed.
🚀 Final Thoughts: Mastering Candlestick Charts
Candlestick charts are like the heartbeat of the market — they tell you the story of price action in vivid detail. Once you master reading candlesticks, you’ll gain an edge in spotting trading opportunities, managing risk, and making confident decisions.
Start by observing daily charts, learn key patterns, and watch how they align with market movements. With time and practice, reading candlestick charts will become second nature — a skill every successful trader needs.